Note
Go to the end to download the full example code.
28-kW PM-SyRM, train current map, measured data#
This example trains a GradNet current map for a 10-pole 28-kW PM synchronous reluctance machine (Brusa HSM1.10.18.04) from a measured dataset. The procedure is the same as in 5.6-kW PM-SyRM, train current map, measured data.
from pathlib import Path

import motulator.drive.gradnet as gn
import numpy as np
from motulator.drive import utils

from motulator_gradnet import (
    Squareplus,
    get_training_data,
    print_current_map_errors_meas,
    train_gradnet,
)
Compute base values based on the nominal values.
nom = utils.NominalValues(U=283, I=78, f=408, P=25e3, tau=49)
base = utils.BaseValues.from_nominal(nom, n_p=5)
Set up the paths and parameters.
p = Path(__file__).resolve().parent if "__file__" in globals() else Path.cwd()

dataset_path = p / "datasets/brusa_meas.npz"
trained_path = p / "trained_models/brusa_meas_curr_map_squareplus_d12_sub100.npz"
subsample = 100
activation = Squareplus
Train the model.
if not trained_path.exists():
    train_gradnet(
        dataset_path=dataset_path,
        base=base,
        save_model_path=trained_path,
        epochs=20000,
        subsample=subsample,
        embed_dim=12,
        activation=activation,
    )
Create the GradNet model and its callable.
Load the dataset for comparison and split it into training and validation sets.
train_data, val_data = get_training_data(
    str(dataset_path), subsample=subsample, base=base
)
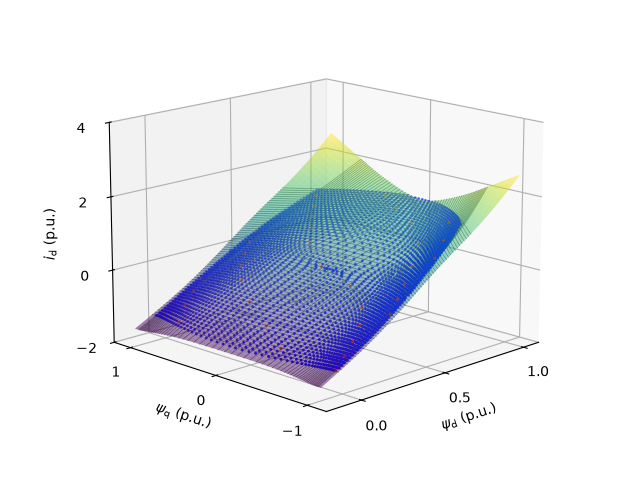
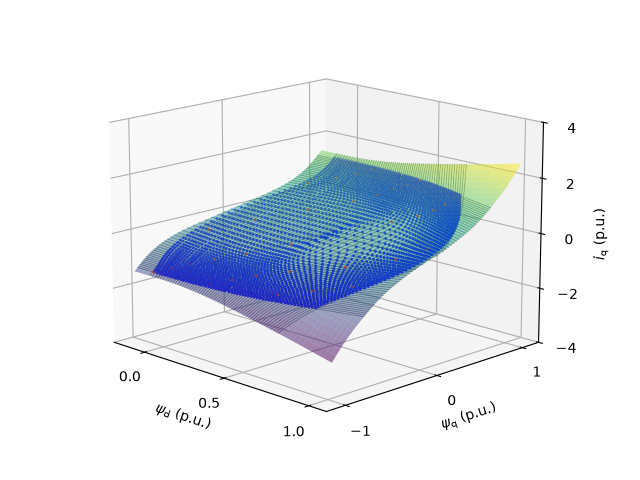
Plot the current map.
# Sample the map on a grid for plotting
current_map = current_map_fcn.as_magnetic_model(
    d_range=np.linspace(-0.15 * base.psi, 1.05 * base.psi, 50),
    q_range=np.linspace(-1.05 * base.psi, 1.05 * base.psi, 50),
)

# Constant current contours corresponding to the measured dataset, for visualization
i_d_levels = np.arange(-145, 146, 5) / base.i
i_q_levels = np.arange(-145, 145, 5) / base.i
current_loci = (i_d_levels, i_q_levels)

utils.plot_map(
    current_map,
    "d",
    base,
    lims={"x": (-0.2, 1.1), "y": (-1.2, 1.2), "z": (-2, 4)},
    ticks={"x": [0, 0.5, 1], "y": [-1, 0, 1], "z": [-2, 0, 2, 4]},
    raw_data=[val_data, train_data],
    current_loci=current_loci,
    axlim_clip=False,
)

utils.plot_map(
    current_map,
    "q",
    base,
    lims={"x": (-0.2, 1.1), "y": (-1.2, 1.2), "z": (-4, 4)},
    ticks={"x": [0, 0.5, 1], "y": [-1, 0, 1], "z": [-4, -2, 0, 2, 4]},
    raw_data=[val_data, train_data],
    current_loci=current_loci,
    axlim_clip=False,
)
Print statistical error metrics.
Current-map error metrics: rmse=0.032 p.u., max=0.133 p.u., std=0.019 p.u.
Total running time of the script: (0 minutes 0.330 seconds)