Note
Go to the end to download the full example code.
2.2-kW IM, LC filter, V/Hz control#
This example simulates open-loop V/Hz control of a 2.2-kW induction machine (IM) drive equipped with an output LC filter.
from math import pi

import matplotlib.pyplot as plt

import motulator.drive.control.im as control
from motulator.drive import model, utils
Compute base values based on the nominal values.
nom = utils.NominalValues(U=400, I=5, f=50, P=2.2e3, tau=14.6)
base = utils.BaseValues.from_nominal(nom, n_p=2)
Create the system model, filter parameters correspond to [1].
par = model.InductionMachineInvGammaPars(
    n_p=2, R_s=3.7, R_R=2.1, L_sgm=0.021, L_M=0.224
)
machine = model.InductionMachine(par)
k = 1.1 * nom.tau / base.w_M**2  # Quadratic load torque profile
mechanics = model.MechanicalSystem(J=0.015, B_L=lambda w_M: k * abs(w_M))
converter = model.VoltageSourceConverter(u_dc=540, modulator=model.CarrierComparison())
lc_filter = model.LCFilter(L_f=8e-3, C_f=9.9e-6, R_f=0.1)
mdl = model.Drive(machine, mechanics, converter, lc_filter)
Configure the control system as open-loop V/Hz control.
vhz_ctrl = control.OpenLoopVHzController(n_p=2, u_s_ref=lambda w_s: 1j * w_s * base.psi)
ctrl = control.VHzControlSystem(vhz_ctrl, slew_rate=2 * pi * 60)
Set the speed reference. The external load torque is zero by default.
ctrl.set_speed_ref(lambda t: (t > 0.2) * base.w_M)
Create the simulation object, simulate, and plot the results in per-unit values.
sim = model.Simulation(mdl, ctrl)
res = sim.simulate(t_stop=1.4)
# sphinx_gallery_thumbnail_number = 2
utils.plot(res, base)
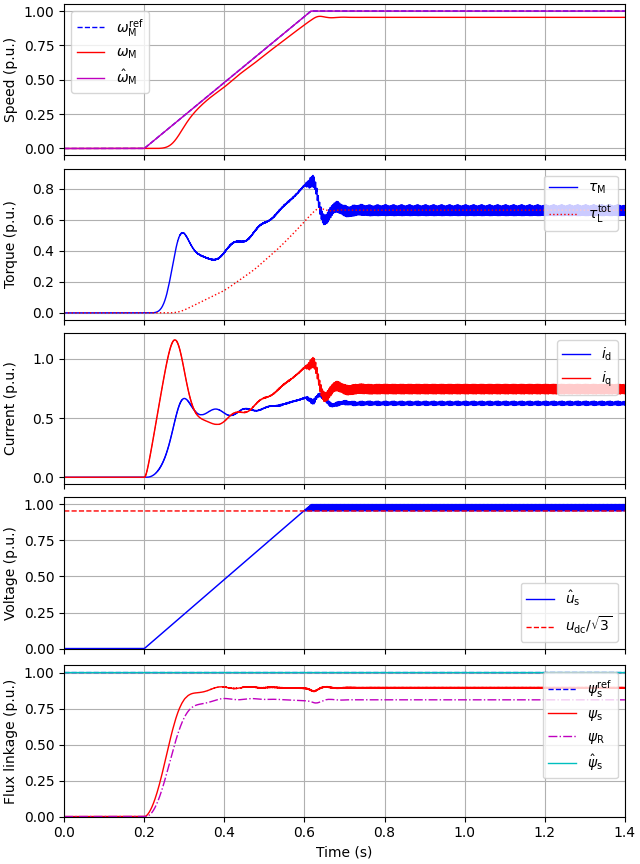
Plot additional waveforms.
t_lims = (1.1, 1.125)  # Time span for the zoomed-in plot

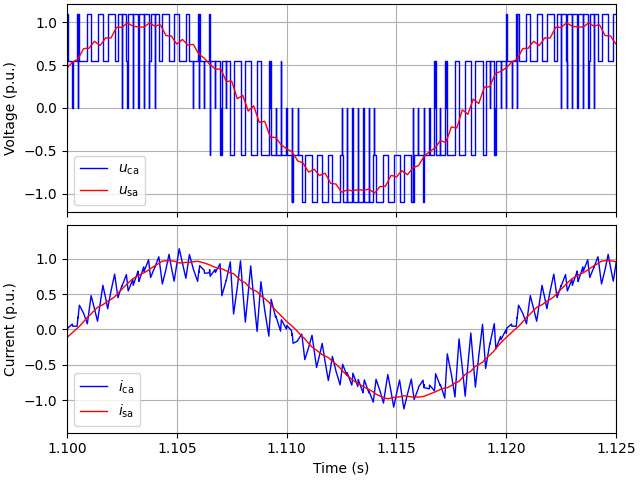
# Plot the converter and stator voltages (phase a)
fig1, (ax1, ax2) = plt.subplots(2, 1, sharex=True)
ax1.plot(res.mdl.t, res.mdl.converter.u_c_ab.real / base.u, label=r"$u_\mathrm{ca}$")
ax1.plot(res.mdl.t, res.mdl.machine.u_s_ab.real / base.u, label=r"$u_\mathrm{sa}$")
ax1.set_xlim(t_lims)
ax1.legend()
ax1.set_ylabel("Voltage (p.u.)")
# Plot the converter and stator currents (phase a)
ax2.plot(res.mdl.t, res.mdl.converter.i_c_ab.real / base.i, label=r"$i_\mathrm{ca}$")
ax2.plot(res.mdl.t, res.mdl.machine.i_s_ab.real / base.i, label=r"$i_\mathrm{sa}$")
ax2.set_xlim(t_lims)
ax2.legend()
ax2.set_ylabel("Current (p.u.)")
ax2.set_xlabel("Time (s)")

plt.show()
References
Total running time of the script: (0 minutes 4.307 seconds)