Note
Go to the end to download the full example code.
10-kVA, start-up, GFL#
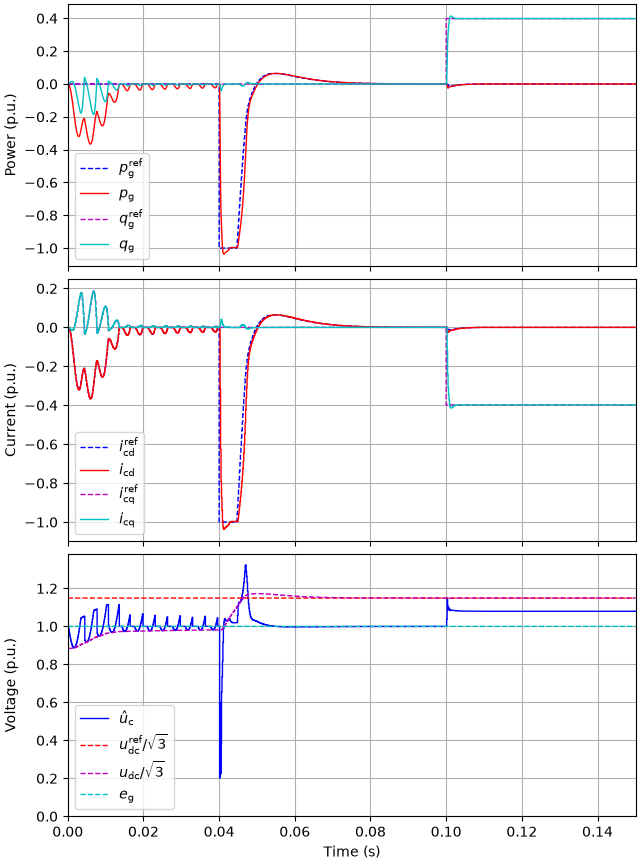
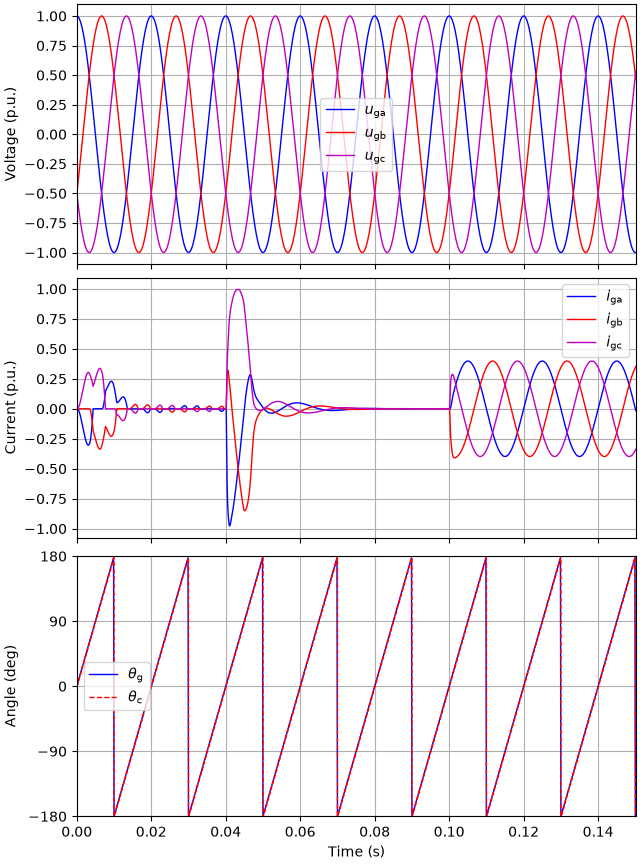
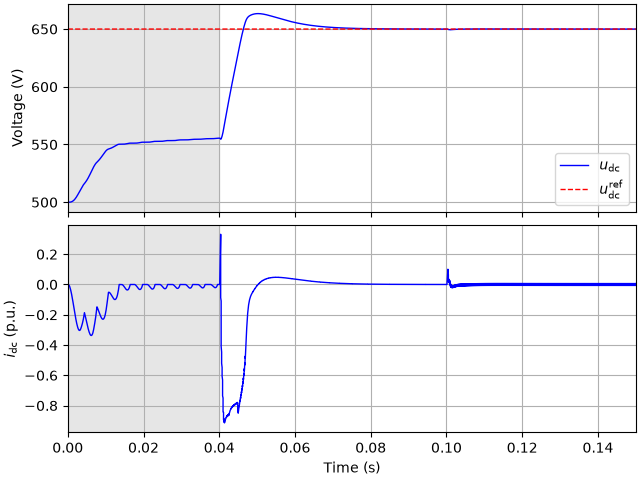
This example simulates the start-up of a grid-following converter with DC-bus voltage control. The converter gates are blocked at first. The DC bus is charged from its initial voltage of 500 V through the antiparallel diodes toward the peak line-to-line voltage of the grid, while the phase-locked loop synchronizes with the grid and the current controller tracks the measured converter voltage. The gates are released at 40 ms, after which the DC-bus voltage controller raises the voltage to 650 V, with the power limited to the nominal power. A reactive power reference step follows.
import matplotlib.pyplot as plt
import numpy as np

from motulator.grid import control, model, utils
Compute base values based on the nominal values.
nom = utils.NominalValues(U=400, I=14.5, f=50, P=10e3)
base = utils.BaseValues.from_nominal(nom)
Configure the system model.
ac_filter = model.LFilter(L_f=0.2 * base.L)
ac_source = model.ThreePhaseSource(w_g=base.w, e_g=base.u)
converter = model.VoltageSourceConverter()
dc_bus = model.DCBus(C_dc=1e-3, u_dc=500, converters=[converter])
mdl = model.GridConverterSystem(converter, ac_filter, ac_source, dc_bus=dc_bus)
Configure the control system.
cfg = control.CurrentVectorControllerCfg(i_max=1.5 * base.i, L=0.2 * base.L)
inner_ctrl = control.CurrentVectorController(cfg)
dc_bus_voltage_ctrl = control.DCBusVoltageController(
    C_dc=1e-3, alpha_dc=2 * np.pi * 30, p_max=base.p
)
ctrl = control.GridConverterControlSystem(inner_ctrl, dc_bus_voltage_ctrl)
Set the gate enable and the references.
ctrl.set_enable(lambda t: t >= 0.04)
ctrl.set_dc_bus_voltage_ref(650)
ctrl.set_reactive_power_ref(lambda t: (t > 0.1) * 4e3)
Create the simulation object, simulate, and plot the results in per-unit values.
sim = model.Simulation(mdl, ctrl)
res = sim.simulate(t_stop=0.15)
utils.plot_control_signals(res, base)
utils.plot_grid_waveforms(res, base)
Plot the DC-bus voltage and the DC current of the converter, the interval with blocked gates shaded. The diodes charge the DC bus toward the peak line-to-line voltage of the grid, the current pulses shrinking as the voltage approaches it.
t_on = res.ctrl.t[np.flatnonzero(res.ctrl.ref.enabled)[0]]
fig, (ax1, ax2) = plt.subplots(2, 1, sharex=True)
for ax in (ax1, ax2):
    ax.axvspan(0, t_on, color="0.9")
ax1.plot(res.mdl.t, res.mdl.dc_bus.u_dc, label=r"$u_\mathrm{dc}$")
ax1.plot(
    res.ctrl.t,
    res.ctrl.ref.u_dc,
    "--",
    ds="steps-post",
    label=r"$u_\mathrm{dc}^\mathrm{ref}$",
)
ax1.set_ylabel("Voltage (V)")
ax1.legend()
ax2.plot(res.mdl.t, res.mdl.converter.i_dc_int / base.i)
ax2.set_ylabel(r"$i_\mathrm{dc}$ (p.u.)")
ax2.set_xlabel("Time (s)")
ax2.set_xlim(0, 0.15)
plt.show()
Total running time of the script: (0 minutes 1.147 seconds)